Modeling Risk as a System—How FORM Connects the Dots for Better Decision-Making
That lack of visibility becomes increasingly risky as mission demands evolve and timelines tighten.
Based on a paper by Tom Monroe, Ph.D., P.E., Marissa Miller, Ph.D., and Mario Beruvides, Ph.D., P.E.
The Problem with Static Risk Tools
Look at almost any risk dashboard in a major program today. What do you see? A list of individual risks, each tagged by likelihood and consequence. Maybe a traffic-light matrix with red, yellow, and green squares. If it’s a Department of Defense program, chances are it follows the Risk, Issue, and Opportunity (RIO) Guide. And if it follows the RIO Guide, those risks are most likely categorized into one of three buckets: cost, schedule, or performance.
At first glance, it seems comprehensive. But dig deeper, and something critical is missing. There’s no way to see how these risks relate to one another.
What if addressing one risk makes another worse? What if two mitigations overlap? What if a delay (schedule) causes a cost increase—and compromises performance?
The problem isn’t the data. It’s the model.
That’s where FORM—the Framework for Objective-Based Risk Management—steps in with a new approach. This post is based on the 2024 paper of the same name by Tom Monroe, Ph.D., P.E., Marissa Miller, Ph.D., and Mario Beruvides, Ph.D., P.E. The trio presented their work at the 2024 American Society for Engineering Management conference.
Both Monroe and Miller work in the Strategic Systems Analysis Group at Systems Planning & Analysis (SPA); Monroe is Program Manager and Principal Risk Capability Leader and Miller is a Technical Program Analyst. They collaborated with Beruvides, who is a professor of industrial and systems engineering at the University of Miami.
In this previous post, we examined how modern program managers should redefine and reimagine risk. Here, we’ll explore how FORM models risk as an interconnected system, enabling smarter decisions, better optimization, and clearer alignment with your program’s goals.
Why the Risk Register Isn’t Enough
Traditionally, risks are logged in a register: a table that names each risk, assigns a probability and consequence, and maybe includes a mitigation plan. But this model treats each risk as an island.
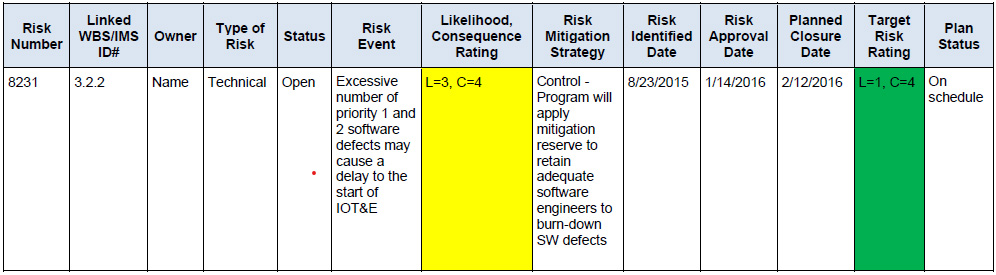
There’s no built-in way to:
- Understand how one risk may trigger or exacerbate another
- See how multiple risks affect the same objective
- Evaluate which mitigations give the best return on effort
- Predict how the overall system changes as events unfold
This reductionist approach leads to overload. Risk teams try to log everything. Decision-makers get overwhelmed. The register becomes a filing cabinet, not a compass.
FORM proposes a different model—one that reflects how people actually think: in networks.
Building the Network: Events, Objectives, Mitigations, and Risks
In FORM, risks are not the events themselves. They are the effects of those events on specific objectives. That distinction unlocks a whole new way of modeling.
Let’s break it down:
Events
- These are things that might happen—positive or negative. A funding cut, a supplier delay, a design breakthrough.
Objectives
- These are the outcomes your program is aiming for—on-time delivery, target performance, cost thresholds, safety standards, or a combination of all of these.
Mitigations
- Actions that can reduce the likelihood or impact of events—or help pull you back toward your objective.
Risks
- The impact an event has on an objective. A single event might create multiple risks, each tied to different objectives.
These are all nodes in a network model. The connections—or arcs—represent the direction and strength of the risk relationship. Mitigations also become nodes in this system, influencing the paths between events and objectives.
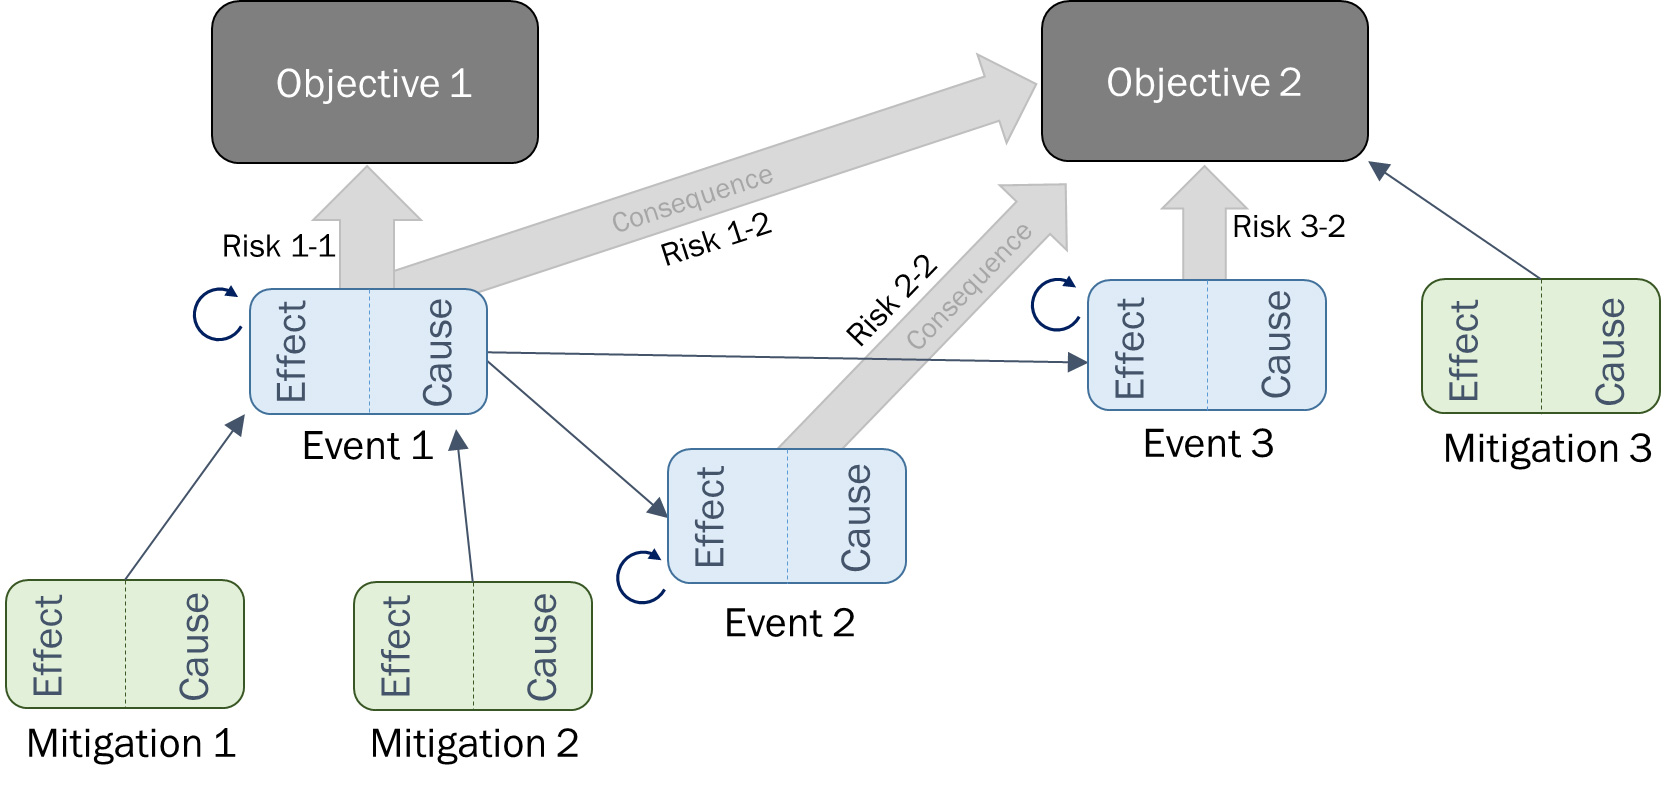
Instead of viewing risk as a flat list, FORM lets you view it as a map—with paths, intersections, bottlenecks, and feedback loops.
What Can This Model Do?
Once you have this network structure, a whole new set of capabilities becomes available:
Prioritize the Right Risks
- Which events, if they occur, would have the greatest impact on your most critical objectives?
- A FORM model helps you identify the highest-leverage risks—not just the ones that “look red” on a matrix.
- Many programs burn time and money on low-impact mitigations simply because they’re easy to implement or highly visible.
- With FORM, you can simulate different mitigation paths and identify which ones move the needle—especially under tight constraints.
Example
One mitigation might reduce the chance of delay by 5%, while another cuts the cost risk by 2% but also improves performance confidence. FORM helps you decide which outcome matters more to your objective, providing the best “bang for your buck.”
Predict How Risk Changes Over Time
- Risk isn’t static. It evolves as your program progresses, just like a living system.
- FORM allows you to track how the network shifts—when risks become irrelevant, when new hazards emerge, and when mitigations lose their effectiveness.
Why Markov Chains Make Sense
To model these transitions over time, FORM leverages Markov chains—a mathematical structure used to model dynamic systems, from financial markets to biological processes.
In a FORM context:
- Each state represents a configuration of events, mitigations, and objectives.
- Probabilities govern the transition from one state to the next (e.g., a supplier issue leads to a delivery delay, which triggers a funding request).
- The model can simulate likely paths, helping you forecast future scenarios and proactively steer toward favorable outcomes.
This is a profound shift from the static, one-dimensional view of risk that dominates most program dashboards.
FORM doesn’t just show you where you are—it shows you where you’re likely going, and what you can do about it.
Addressing Common Challenges
“How many risks should we track?”
Not all risks deserve equal attention. FORM encourages parsimony—include only those risks and relationships that meaningfully affect your objectives. This keeps the model clear and usable.
“Isn’t this too complex for real-world teams?”
Surprisingly, no. The initial effort to define objectives and structure the network pays off quickly. Decision-makers don’t need to interpret raw math—they get intuitive outputs like prioritized heatmaps, optimized mitigation paths, and evolving risk trajectories.
“What if our data is incomplete or uncertain?”
That’s normal. FORM supports subjective probabilities—based on expert judgment—especially when empirical data is limited. The focus is on relative impact, not perfect precision. That said, FORM can help you prioritize which risks are worth the extra effort to better nail down the uncertainty.
A Real Example: Shifting the Goalposts
The paper by Monroe, Miller, and Beruvides offers a telling case: the U.S. Navy’s DDG-51 destroyer program. Due to cost overruns, the Navy removed the helicopter hangar from the first ships in the class—a tradeoff to maintain schedule and budget.
This decision brought the program “closer” to its new (reduced) objectives. But it also introduced a performance limitation that would later echo throughout the fleet.
With FORM, the ripple effects of that decision—and the risks it addressed or created—could have been modeled explicitly. That clarity would help leadership decide: is it worth shifting the objective, or should we find another mitigation?
Connected Risk, Smarter Decisions
FORM doesn’t promise to eliminate risk. No model can. But it does promise to make risk visible, relational, and actionable—in a way that mirrors how humans actually evaluate uncertainty.
It replaces fragmented, compliance-driven tracking with a living model that aligns with how your program navigates toward success.
In today’s world of complex systems and shrinking margins, that’s not just a better tool—it’s a strategic necessity.
Want to explore how FORM could reshape risk modeling in your organization? Get in touch with SPA to pilot an objective-based risk network tailored to your program.
Subscribe to our newsletter
We respect your privacy.
[ Related Articles ]